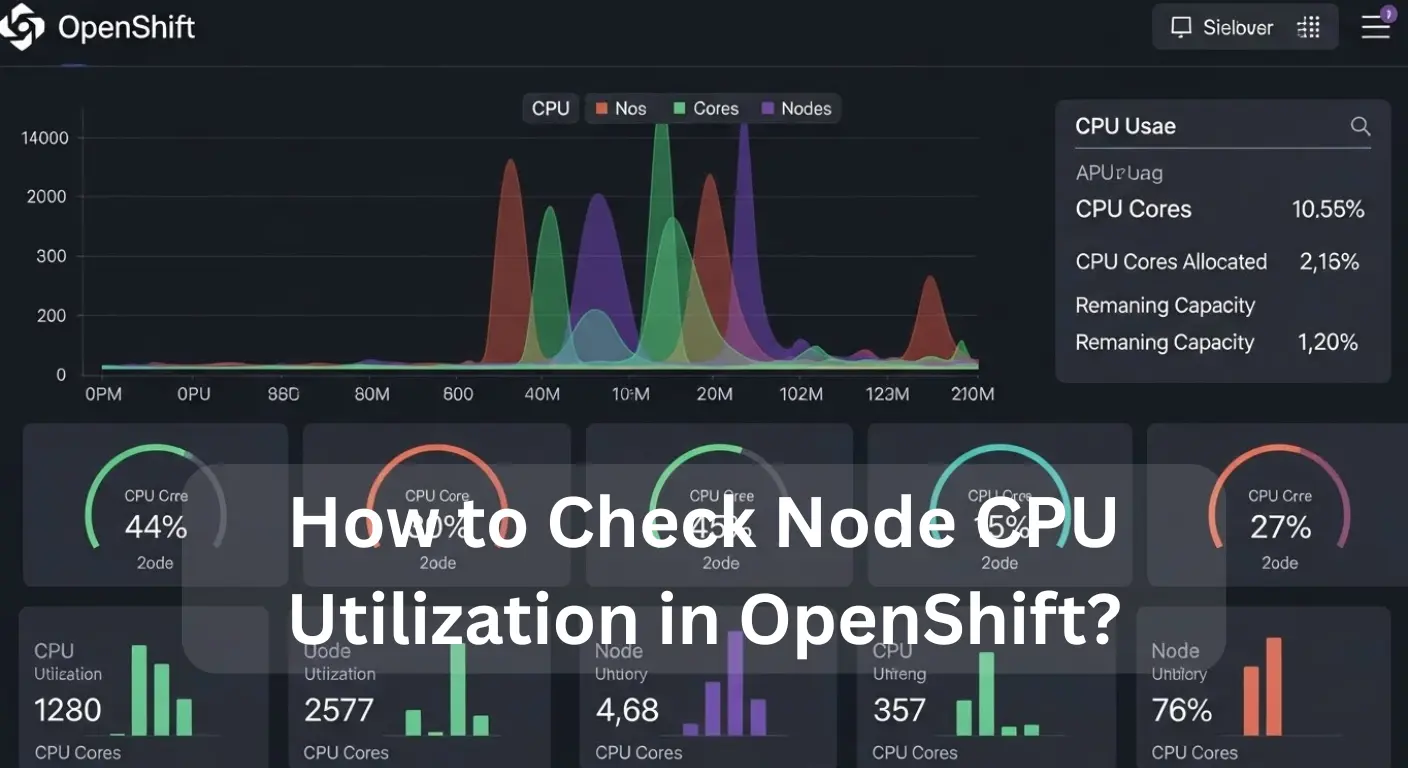
To check Node CPU utilization in OpenShift, use the oc adm top nodes command. This command provides CPU and memory usage details for each node in your cluster. You can also use the OpenShift Console for real-time monitoring.
This article will guide you through various methods to check Node CPU utilization in OpenShift, helping you optimize resource management and maintain cluster health.
What Does Node CPU Utilization Mean in OpenShift?
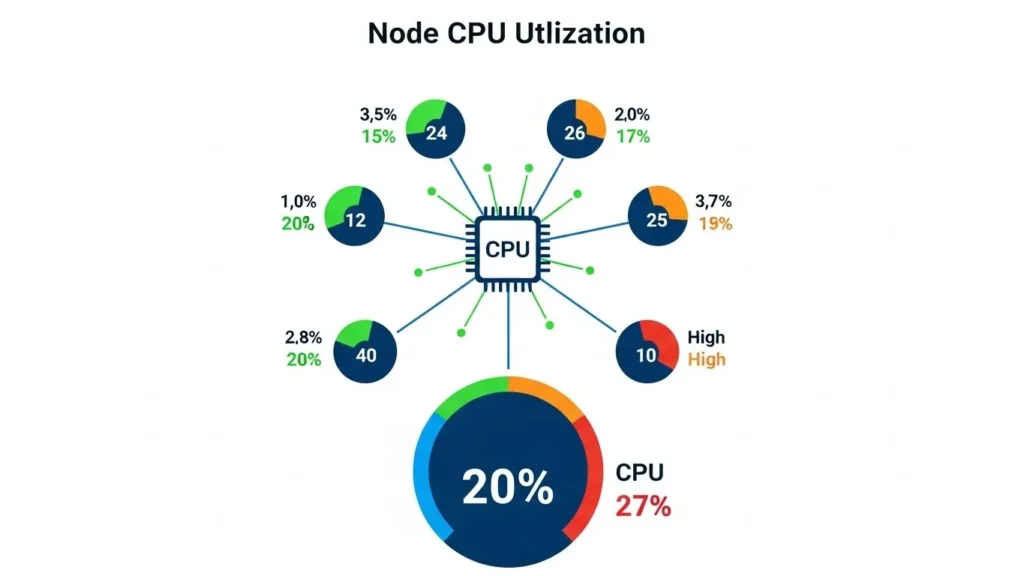
Node CPU utilization in OpenShift refers to how much of a node’s CPU resources are being used by workloads and applications. Monitoring this metric is crucial for ensuring optimal cluster health and system stability. High CPU usage can lead to CPU throttling, slowing down performance, and possibly causing pod failure.
Regularly checking CPU metrics allows for efficient workload management, helping avoid over-utilization and improving the overall performance of your cloud infrastructure. Using tools like Node Exporter can help track these metrics easily.
How Do You See CPU Usage With oc adm top?
To check CPU usage in OpenShift, use the oc adm top nodes command. This command provides real-time CPU metrics for each node, helping monitor CPU utilization, node health, and system stability. If you notice CPU over-utilization or throttling, it could indicate potential issues like pod failure or poor workload management. By analyzing this data, you can ensure efficient node scaling and improve cluster performance.
Also Read: Can I Use Cpu Cable For Gpu?
How to View Node CPU Capacity and Allocatable CPU?
1. Using oc adm top nodes Command:
- Step 1: To check the CPU capacity and allocatable CPU on your OpenShift nodes, use the command oc adm top nodes.
- Result: This will display real-time data for CPU usage, available capacity, and allocatable resources on each node in the cluster.
2. Using oc describe node <node-name> Command:
- Step 2: Run oc describe node <node-name> to get detailed information.
- Result: This command provides comprehensive insights into node resources, including CPU limits, allocatable CPU, and usage stats.
| Node Name | CPU Capacity | Allocatable CPU | CPU Usage |
| node-1 | 4 CPUs | 3.8 CPUs | 1.5 CPUs |
| node-2 | 8 CPUs | 7.5 CPUs | 3.0 CPUs |
| node-3 | 6 CPUs | 5.5 CPUs | 2.8 CPUs |
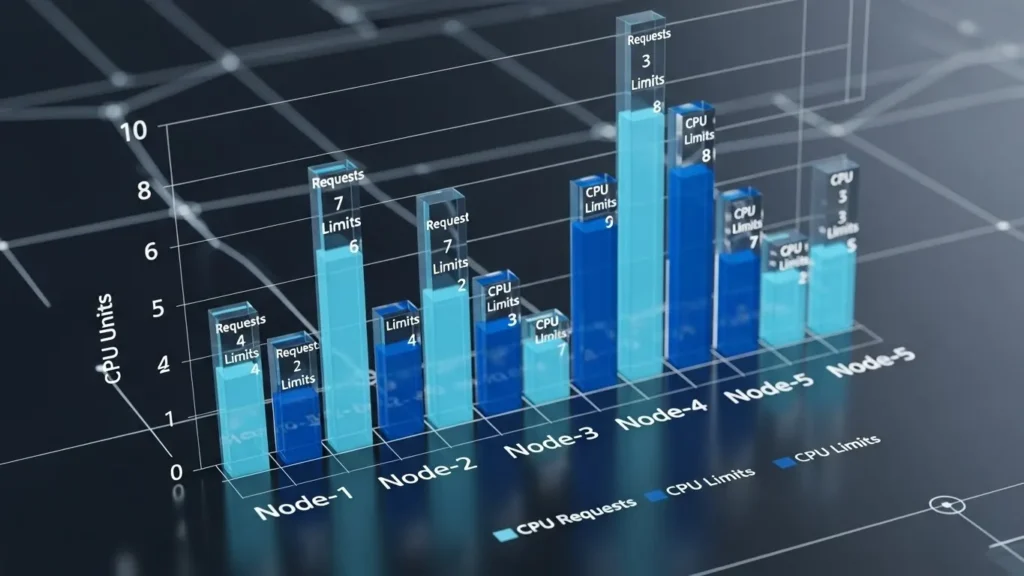
How to Check CPU Requests and Limits Per Node?

To check CPU requests and limits per node in OpenShift, follow these steps:
Use the oc describe command:
- This command gives detailed information about a node’s resources, including CPU requests and limits for each pod.
- Run this command:
oc describe node <node-name>
Example:
oc describe node node1
Check real-time CPU usage with oc adm top nodes:
This command provides a live snapshot of resource usage, helping you monitor CPU over-utilization and ensure system stability.
oc adm top nodes
Example Output:
NAME CPU(cores) MEMORY(bytes)
node1 500m 2Gi
node2 200m 1Gi
Monitor pod resource requests and limits:
For detailed CPU requests and limits for each pod, use:
kubectl get pod <pod-name> -o=jsonpath='{.spec.containers[*].resources}’
Example Output:
requests:
cpu: 100m
limits:
cpu: 500m
Why is this important?
Monitoring CPU throttling and setting node scaling properly helps prevent pod failure and ensures efficient workload management. This prevents cluster health issues and keeps your cloud infrastructure running smoothly. Proper resource allocation ensures that Node Exporter metrics are within acceptable limits, and CPU metrics queries help identify performance bottlenecks before they impact your system.
This comprehensive check allows you to maintain an optimal environment in OpenShift, ensuring smooth node operations and preventing performance issues caused by resource mismanagement.
Also Read: Is 4000RPM Too Low For CPU Fan?
Why Do CPU Numbers Differ in Top and Prometheus?
The difference in CPU numbers between Top and Prometheus usually arises due to how each tool collects and reports data.
Real-Time Data vs Time-Series Data:
- Top: Displays CPU metrics in real-time by sampling at short intervals. It gives a quick snapshot of current CPU performance, but can miss short CPU spikes or over-utilization patterns that might affect system stability.
- Prometheus: Collects detailed time-series data over a long period, allowing users to query and track CPU performance trends. It’s great for analyzing node scaling, identifying CPU throttling, and monitoring the overall health of clusters.
Measurement Frequency:
- Top: Updates continuously (usually every second), offering instant feedback but lacking the granularity needed to assess long-term workload management. It’s suitable for quick checks but doesn’t capture deeper issues like pod failure or changes in cluster health.
- Prometheus: Pulls data at configurable intervals, storing it for long-term analysis. It helps track CPU usage trends across time, which is crucial for understanding system stability and predicting potential failures in cloud infrastructure.
Data Aggregation:
- Top: Aggregates CPU usage quickly, offering a high-level view. However, it can overlook important details like CPU throttling or brief spikes that impact node performance.
- Prometheus: Provides detailed metrics and allows custom aggregation over time, making it effective for querying CPU metrics, spotting performance bottlenecks, and diagnosing CPU over-utilization.
Granularity:
- Top: Shows overall CPU performance but lacks the detail required to track individual processes or threads, which is important for managing system health at a granular level.
- Prometheus: Tracks CPU metrics down to individual nodes, pods, or processes. This helps users monitor workload management and detect potential issues like node failure or irregular CPU consumption in a cluster.
How to Query Node CPU Usage With Prometheus?
To query node CPU usage with Prometheus, use the node_cpu_seconds_total metric, which records CPU time in various modes. To track CPU usage in user mode, use this query:
rate(node_cpu_seconds_total{mode=”user”}[5m])
This Prometheus query shows the CPU usage over the past 5 minutes. You can also modify it to view other modes, like system or idle. Make sure your Prometheus server is configured to collect node metrics correctly for accurate data.
What PromQL Metric Shows Node CPU Utilization?

To check Node CPU utilization in OpenShift, use the command oc adm top nodes. It displays real-time CPU metrics for each node in the cluster, helping you monitor system health and spot CPU over-utilization. Regular checks prevent pod failures and maintain cluster health. Node Exporter can also be used to track CPU metrics, helping with workload management and system stability.
How to Use Grafana to Track CPU Over Time?
- Install Grafana and link it to Prometheus for accurate CPU metrics collection.
- Use Node Exporter to monitor CPU utilization and get detailed metrics (e.g., node_cpu_seconds_total).
- Create a new dashboard in Grafana to track CPU usage over time.
- Add a panel to visualize CPU throttling and over-utilization, ensuring system stability.
- Customize the panel to show trends and help detect issues like pod failure or node scaling problems.
- Use CPU metrics queries to measure CPU load and identify when your cluster health might be at risk.
- Track workload management for better resource distribution and prevent CPU overload.
This approach helps maintain cloud infrastructure performance and optimize node scaling for long-term system health.
When Is System Reserved CPU Usage Too High?
When system-reserved CPU usage is too high, it can cause slow performance and application crashes. If CPU usage is consistently over 80-90%, your system might be overloaded. To fix this, try closing unnecessary apps, updating system drivers, or checking for malware. You may also need to upgrade hardware if the issue persists. Regular monitoring ensures smoother performance and prevents system issues.
Also Read: Can I Sell My Used CPU?
How to Find CRI O or Kubelet CPU Issues?
To find CRI-O or Kubelet CPU issues, follow these steps:
- Check CPU Usage: Use oc adm top nodes or kubectl top nodes to monitor CPU over-utilization on your cluster nodes. This helps identify any CPU throttling or resource bottlenecks.
- Inspect Node Logs: Look at CRI-O or Kubelet logs using journalctl -u crio or kubectl logs to find issues like pod failures or system errors that affect node performance.
- Monitor with Prometheus: Set up Node Exporter to collect CPU metrics and use Prometheus to track node performance over time. This will help with workload management and detecting potential cluster health issues.
- Alert Setup: Configure Prometheus alerts for CPU over-utilization to detect system instability before it impacts your cloud infrastructure.
- Scale Nodes: If CPU usage consistently exceeds limits, consider node scaling to balance the workload and prevent downtime.
By keeping track of CPU performance and scaling nodes as needed, you can ensure system stability and avoid pod failures. This approach enhances cluster health and ensures optimal performance across your cloud infrastructure.
How to Set Alerts for High Node CPU Usage?
To set alerts for high node CPU usage in OpenShift, you can use the oc adm top command to track CPU usage across your nodes. Prometheus can be configured to monitor usage levels. Set an alert when CPU usage exceeds a specific threshold, and Grafana can be used to visualize the data. This way, you’ll receive notifications whenever the node CPU usage becomes too high, ensuring smooth performance.
How to Export Node CPU Data for Reports?
To export Node CPU data for reports in OpenShift, use the command oc adm top nodes to check CPU usage and ensure cluster health. If you need more detailed CPU metrics, configure Prometheus to collect data over time. This helps prevent CPU over-utilization and node scaling issues. You can export this data through Prometheus’s API for reporting, helping you improve workload management and avoid pod failure or CPU throttling that can affect system stability. Monitoring these metrics is crucial for maintaining a stable cloud infrastructure.
Ways to Check Node CPU Usage in OpenShift:
To monitor node CPU usage in OpenShift, you can use several methods to ensure your cluster runs smoothly:
| Method | Description | Command/Tool |
| Real-time CPU Usage | Track the live CPU usage for each node to identify performance issues. | oc adm top nodes |
| Node CPU Capacity & Allocatable | View CPU capacity, allocated resources, and available limits for each node. | oc describe node <node-name> |
| Advanced Monitoring | Set up continuous CPU tracking and automatic alerts for high usage. | Prometheus, Grafana |
How Node CPU Metrics Flow in OpenShift?
In OpenShift, Node CPU metrics flow by tracking the CPU usage of nodes through tools like oc adm top and Prometheus. This data is vital for workload management and maintaining cluster health. If CPU over-utilization occurs, it could lead to issues like CPU throttling or even pod failure, affecting overall system stability. Node Exporter can be used for precise CPU metrics queries, helping administrators manage resources and scale nodes efficiently to avoid performance bottlenecks in the cloud infrastructure. Monitoring these metrics ensures a smooth-running system and prevents downtime.
Conclusion:
Monitoring Node CPU utilization in OpenShift is crucial for maintaining cluster health and system stability. By using commands like oc adm top nodes and tools like Prometheus, Grafana, and Node Exporter, administrators can track CPU usage, prevent throttling, and optimize resource allocation. Regular checks and efficient workload management ensure smooth system performance and avoid pod failures.
FAQ’s:
1. Is it possible to check Node CPU utilization using OpenShift CLI?
Yes, you can use the oc adm top nodes command to check Node CPU utilization in OpenShift CLI.
2. Can I monitor Node CPU usage in OpenShift using the OpenShift Web Console?
Yes, you can monitor Node CPU usage in the OpenShift Web Console by navigating to the “Monitoring” section.
3. Does OpenShift provide automatic alerts for high Node CPU utilization?
Yes, OpenShift allows you to configure alerts for high CPU utilization using the Prometheus monitoring tool.
4. What tools can I use to monitor Node CPU utilization in OpenShift?
Tools like oc adm top nodes, Prometheus, and Grafana can be used to monitor Node CPU utilization.
5. How can I optimize Node CPU usage in OpenShift to improve cluster performance?
You can optimize Node CPU usage by setting resource limits and requests, adjusting pod scheduling, and scaling nodes as needed.
Also Read: Do I Need To Reinstall Windows With New CPU?


